


Beyond glory: Analysing Manchester United’s financial health in the post-Ferguson era
Manchester United FC are one of the most well-known names in football history with a global fan base that can rival any other. However, instead of a string of successes, most headlines about the club in recent years have been about their struggles both on and off the pitch. The recent partial takeover by Sir Jim Ratcliffe promises a turnaround, but what challenges are they facing exactly? With the help of Football Benchmark data & analysis, let’s explore the financial evolution of the club in four selected areas.
The retirement of Sir Alex Ferguson at the end of the 2012/13 season was a seismic event in the world of football, signalling the end of a legendary era for Manchester United FC. Under Ferguson’s tenure, the club not only achieved unparalleled success on the pitch but also solidified its status as a financial powerhouse.
When Ferguson gave his farewell speech on the pitch of a packed Old Trafford in May 2013 with his 13th league title secured already, not many would have thought that Man. United would not be crowned Premier League champions again for the next decade and counting. While there have been a few triumphs in cup competitions, the club has not been able to replicate the lofty heights they have perhaps grown accustomed to. Many have tried, but to no avail: there have been five permanent managers and three caretaker/interim appointments at the “Red Devils” since 2013, which is an unusual turnover after decades of stability on the bench. Simultaneously, the club also started to feel the financial repercussions of its on-field underperformance, despite its record commercial deals.
Are things about to change? Sir Jim Ratcliffe, billionaire owner of the INEOS conglomerate purchased a 25% stake in the club from the Glazer family. Importantly, Ratcliffe’s team also took charge of the football operations at the club, making it clear that his intention is to return the club to the “glory days”.
In this article we explore the Man. United’s post-Ferguson from four perspectives (revenue, stadium, return on investment into the squad and player valuation) and identify the related key challenges faced by the new management. The analysis starts from the 2012/13 season (the last one with Ferguson in charge) and ends with 2022/23 (the last one for which audited full financial results are available). All financial and operational data presented in this article was sourced from the Football Benchmark – Club Finance & Operations and Player Valuation platforms.
Operating revenues
In the 2012/13 season, Man. United had the third highest operating revenue among all clubs; their GBP 363 million was bettered only by Real Madrid CF (EUR 518m, equivalent to GBP 427m at the time) and FC Barcelona (EUR 483m or GBP 398m). At home, no other Premier League clubs could come close to them: the second-best performing English club that year was Manchester City FC with GBP 272m of operating revenues, 25% below their local rivals.
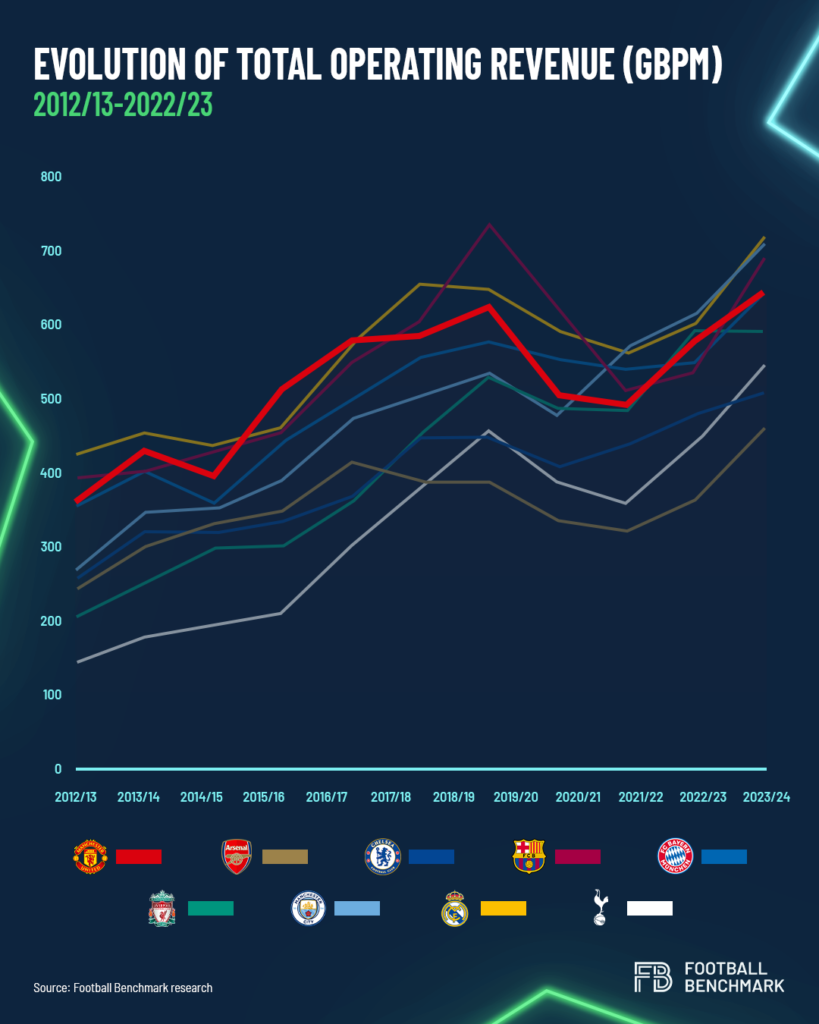
The following decade brought unprecedented financial growth at the top of the football pyramid with clubs turning the global interest in the sport into ever-increasing commercial and media rights income. Even though their fortunes on the pitch took a dip, Man. United still had an enduring commercial appeal, as shown by their long-term kit supplier deal with Adidas (GBP 900m over 10 years until 2035) and lucrative main shirt sponsor agreements. However, other clubs have also benefited from the global growth of the sport, and some have even overtaken Man. United (GBP 650m total revenue in 2022/23). Riding a wave of sustained sporting success, local rivals Manchester City FC first exceeded United’s total operating revenue in the 2020/21 season and have not relinquished their lead ever since.
Over the same period, there has been a major shift in the income breakdown of United, as well. Whereas in 2012/13 almost a third of their operating revenue came from the matchday category, this share dropped to 21% by 2022/23 as commercial and broadcasting revenue had a higher growth rate. Moreover, around half of the club’s total operating revenue was attributed to commercial sources in every season over the analysed period.
Broadcasting rights income is also a key source, but it is generally more volatile than commercial. Even though the money distributed by the Premier League provides a very strong and mostly predictable foundation in this regard, participation in UEFA club competitions is also crucial to secure high broadcasting income and that component is more dependent on sporting performance. As United qualified for the UEFA Champions League group stages on only six occasions without Ferguson at the helm, they missed out on hundreds of millions of pounds in aggregate from UEFA revenues.
Stadium and matchday revenues
Their relative share in the income structure of top clubs might have decreased over the last decade, but boosting stadium and matchday revenues are still crucial for long-term financial health. Investment into large-scale stadium (re)developments has been at the forefront of many clubs; for example, Real Madrid and Barcelona have both committed to significant capacity increases in their historic venues with the aim of improving their revenue-generating capabilities.
In stark contrast, the last major development at Old Trafford, United’s home ground, was in 2006 when 8,000 new seats were added. Almost two decades on, the wear and tear of the stadium is an often-discussed topic among fans and the media alike.
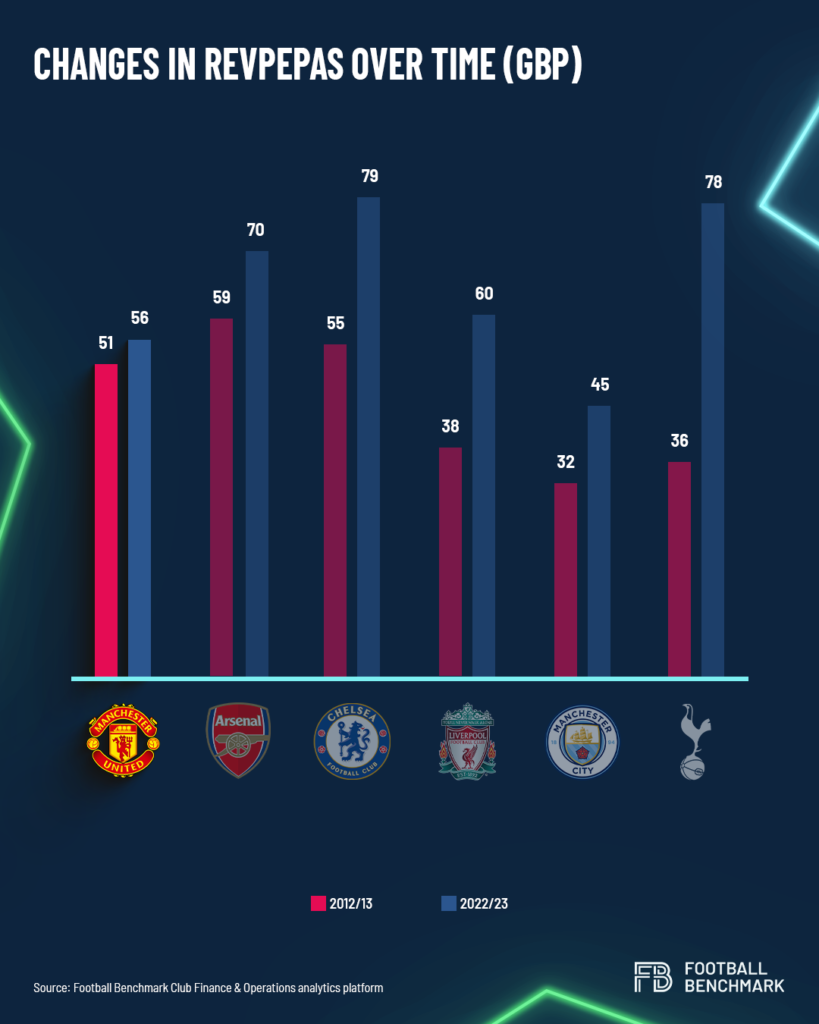
The virtual standstill in this regard is also clear when looking at the club’s RevPEPAS metric in comparison to rivals. This indicator shows how much income they generate from each seat in each home match. As shown by the chart, United’s RevPEPAS value grew by only approx. 10% between 2012/13 and 2022/23. Admittedly, keeping season ticket prices at the same level for several seasons was a contributing factor to this. During the same period, several English clubs have overtaken Man. United in this area. Most notable among them are Tottenham Hotspur FC, who have more than doubled their matchday income thanks to their new stadium.
What are the stadium plans at United? According to recent reports, the primary option being considered is the construction of a new, state-of-the-art 100,0000-seater stadium as part of a regenerated Trafford Park. An economic report estimated that the overall project could deliver an additional GBP 7.3 billion per year to the UK’s economy and create over 90,000 new jobs.
Squad cost management and on-pitch performance
Looking at the expenses side in our financial analysis, the evolution of staff costs at Man. United shows that the post-Ferguson era has seen substantial investment in the playing squad. The last decade saw several high-profile names signed by the club on significant wages, including Zlatan Ibrahimovic, Paul Pogba, Romelu Lukaku and, of course, Cristiano Ronaldo. However, these signings did not reach the goal of restoring the club’s competitive edge and caused a significant increase in overall staff costs.
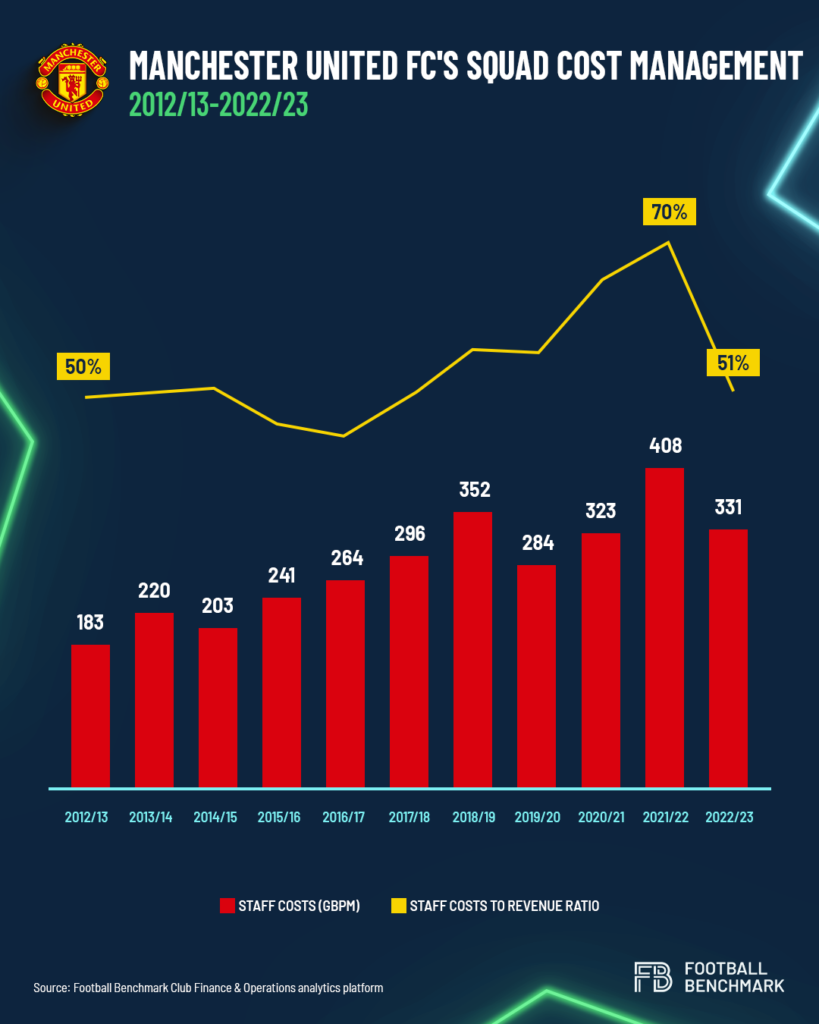
Moving one step further, we can approximate the total squad cost by adding the amortisation of players’ registrations to the staff costs. While the latter is mostly made up of player salaries, the former is a product of spending on transfer fees. The chart shows a clear upward trend in squad costs over time: while staff costs grew by 80% since 2012/13, the increase in amortisation of players’ registrations was over 300%. High transfer fees paid can have a long-lasting impact.
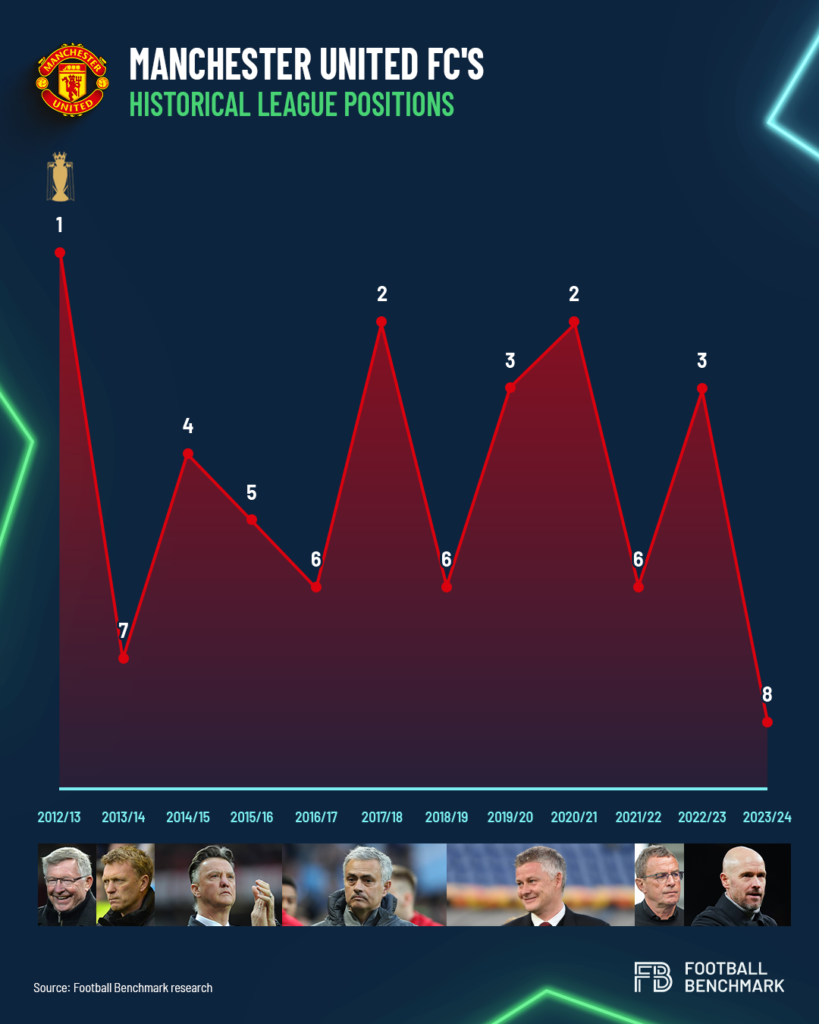
So, what did this investment lead to on the pitch? Man. United’s league positions since the 2012/13 title are a grim reading for the fans: the best achievement was a second-place finish on two occasions, but even those were followed by 6th positions in the season after.
The ‘staff costs spent per league points won’ metric is also instructive. In 2021/22 the club spent GBP 7.0 million per every point earned; only Chelsea FC’s GBP 9.2 million result in 2022/23 was worse among all Premier League clubs in the analysed period when they finished 12th. For additional context, Man. City’s metric was around GBP 3-5 million in these seasons: even though they had similar or slightly higher staff costs than United, they achieved much better results in the Premier League (and in other competitions).
Moving forward, the main challenge is to improve competitiveness with investments in the squad that are more efficient than in the past. Profit and Sustainability (PSR) rules and the UEFA Financial Sustainability regulations do not facilitate this objective.
Player valuation
Finally, let’s assess United’s main “assets”, the footballers themselves. An insightful aspect is the estimated market value of the players; for this exercise, we are using values sourced from the Football Benchmark – Player Valuation data platform.
As a general rule, when a player is signed by a top club in one of the European “Big Five” leagues, their market value is expected to increase due to a variety of factors. For one, they are likely to play in a higher-ranked league for a richer club and will be therefore on a longer contract than before the transfer. But what happens afterwards? If the player delivers on their promise with sustained good performances and the team is also successful, then their market valuation could rise even further, especially if they are also relatively young. Unsurprisingly, looking at a selection of recent signings made by Man. United, this rarely happened with their players.
The chart shows Football Benchmark market values for Man. United transfers since 2019 on three separate dates: right after signing for the club, after one year and after two years. Importantly, there are only two who had a higher value after two years at the club compared to their initial valuation: Bruno Fernandes (+42%) and Aaron Wan-Bissaka (+30%). Lisandro Martínez would also likely be in this category if he had not suffered a serious injury that limited his availability.
Bruno Fernandes is undoubtedly one of the best transfers of the post-Ferguson era: he averages over 0.6 goals or assists per game for Man. United and is now the captain of the team. The issue is that similar success stories are few and far between.
At the other end of the spectrum, we find names such as Antony, Sancho, Casemiro, Varane, Alex Telles or Van de Beek. All of them were signed with high hopes, but due to a variety of reasons, they could not live up to those expectations, which is reflected in the steep decline of their estimated market values over time. This affects the club’s ability to generate profits from player sales because – if they were to sell them – these players would be unlikely to command high transfer fees.
The challenge for the new management is to improve talent identification and find consistency in a recruitment strategy. Purchasing players at a younger age and avoiding stars who are at or past their prime could also help in this regard as emerging talents are more likely to increase their market value. The first two permanent signings after the arrival of Ratcliffe seem to be in this mould already: Joshua Zirkzee (signed from Bologna) is 23 years old, while Leny Yoro (from Lille) is only 18.